In this blog, we’ll cover the latest RV and travel data news. January 2025 RV production numbers are out, and we’ll cover the latest travel data so you can better gauge if it’s time to buy, sell or hold an RV. Later in the news, we’ll discuss the latest national park dust-up around funding cuts.
RVIA Numbers
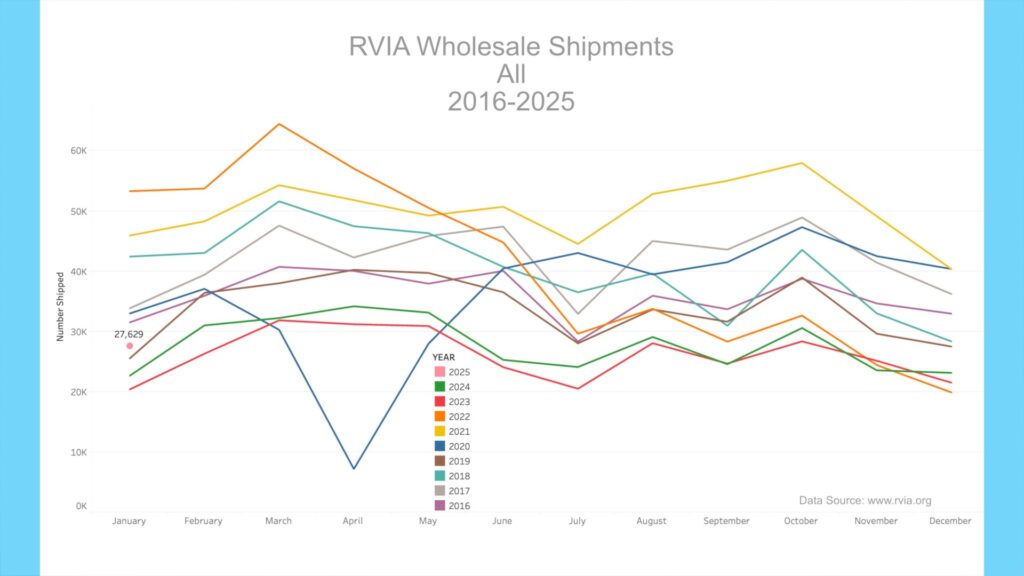
On February 24th, 2025, the RVIA posted the latest RV wholesale shipment data for January 2025. Production increased significantly compared to the prior year, with 27,629 total RVs shipped in January, up 4,955 or 21.85% from January 2024. January 2025 beat both 2023 and 2024 January shipments. Travel trailer shipments also increased significantly year-over-year, with 19,100 units shipped in January 2025 vs. 15,432 a year ago (a 23.77% increase).

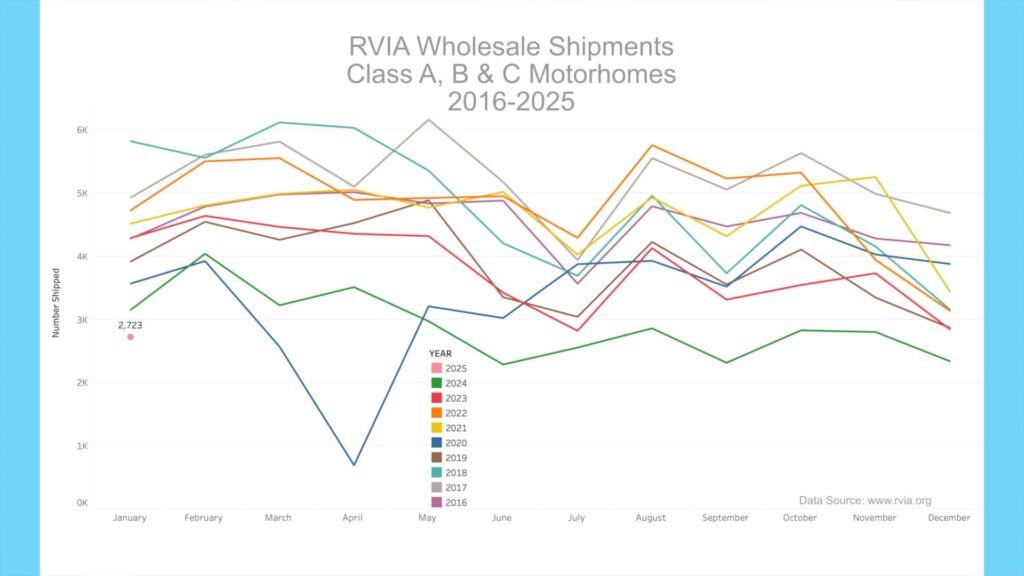
Unfortunately, the bad news continued for motorhome shipments. Motorhome shipments, which include Class A, B & C motorhomes, witnessed its lowest January since before 2016, with only 2,723 units shipped, down 428 or 13.6% from January 2024.
RV Trader Numbers
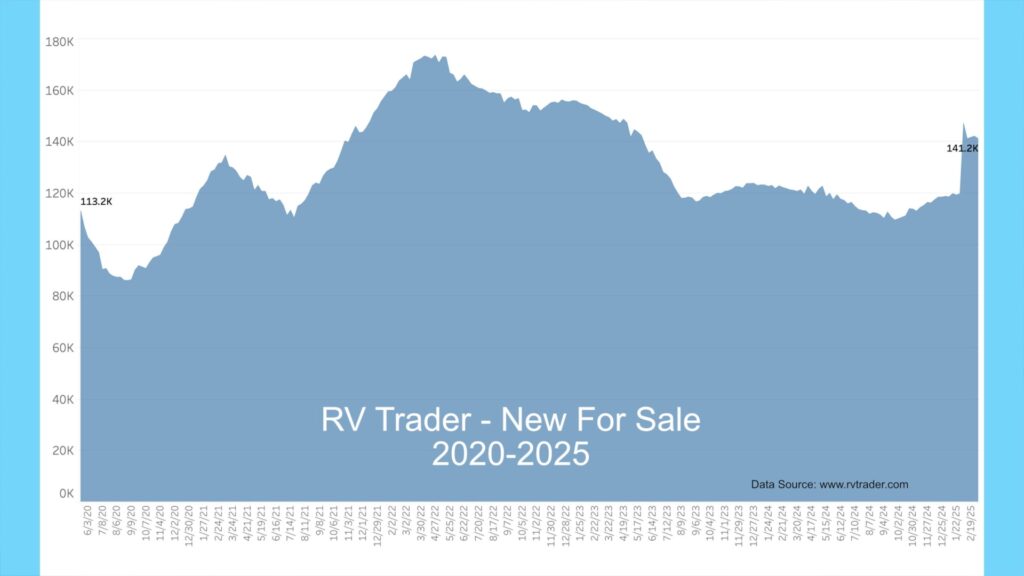
As we report on RVs for sale on RVTrader.com, a site we have used as a proxy for dealer inventory for several years, it is important to note that since our last report at the beginning of last month, a large dealer has apparently pushed much of their new volume to the platform. You’ll see this as an anomaly in the following charts.
RVs for sale on RVTrader.com have increased sharply since last month, with 141,159 new RVs for sale as of March 3rd, 2025. This is up from 119,765 or a whopping 21,394 units from about a month ago and up 19,889 from a year ago. Again, this data anomaly is likely due to a dealer posting a large amount of their new inventory on the system.
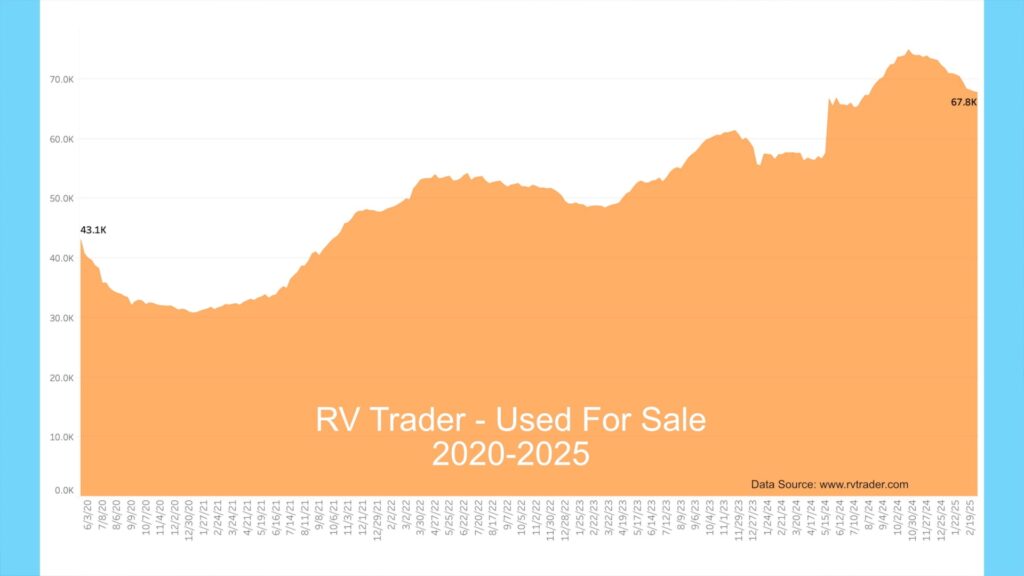
Used units have decreased in the past month, with 67,785 used RVs for sale as of March 3rd. This is down by 2,673 units vs. about a month ago and up by 10,154 or up 17.6% compared to a year ago. This continued record level of used RVs for sale is evidence of the shedding of pandemic trailers by recent RV buyers.
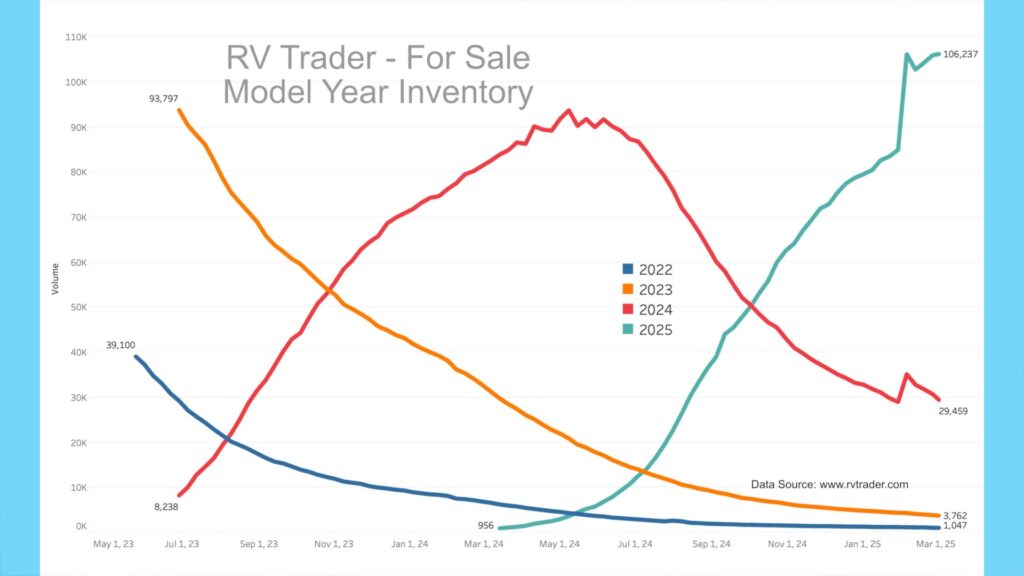
Our model year chart shows new model volumes for 2022 through 2025 since May of 2023. As dealers unload the older units, 2022 models, as indicated by the blue line, have decreased from 39,100 to 1,047 units. The orange line shows 2023 models going from 93,797 to 3,762 units since late June 2023. Meanwhile, the red line shows 2024 models on RVTrader.com. In late June 2023, there were 8,238 new 2024s, and now there are 29,459, having peaked this past summer and running off quickly. Also, 2025 units, as shown by the teal line, are ramping up. There are currently 106,237 units for sale, increasing by 21,278 in the past month.
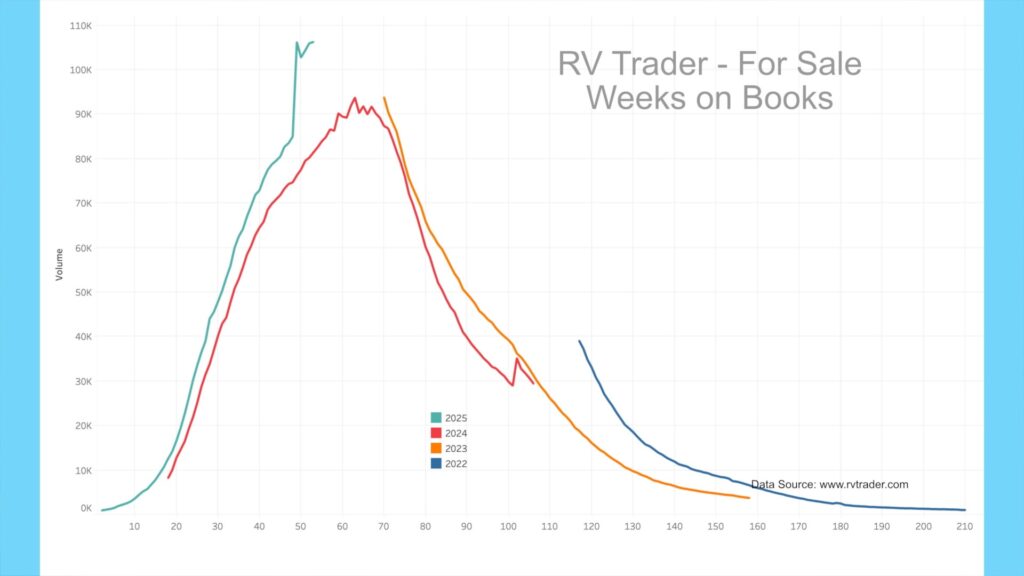
Looking at the model year data by the number of weeks on market, we see that 2025s (teal line) is ramping up quicker than 2024s (red line) at the same number of weeks on market. Also, the 2024s are falling off faster than the 2023s (orange line). The 2024 model year looks like a historically low production run that ended about six months ago. It sure appears the industry is betting that 2025 models will sell more swiftly than 2024s.
As a reminder, many but not all dealers advertise on RVTrader.com to sell inventory. It remains an excellent proxy for overall dealer inventory. You can follow my account on X at @JohnMarucci to receive weekly updates on this data.
High-End Market – Colonial Airstream
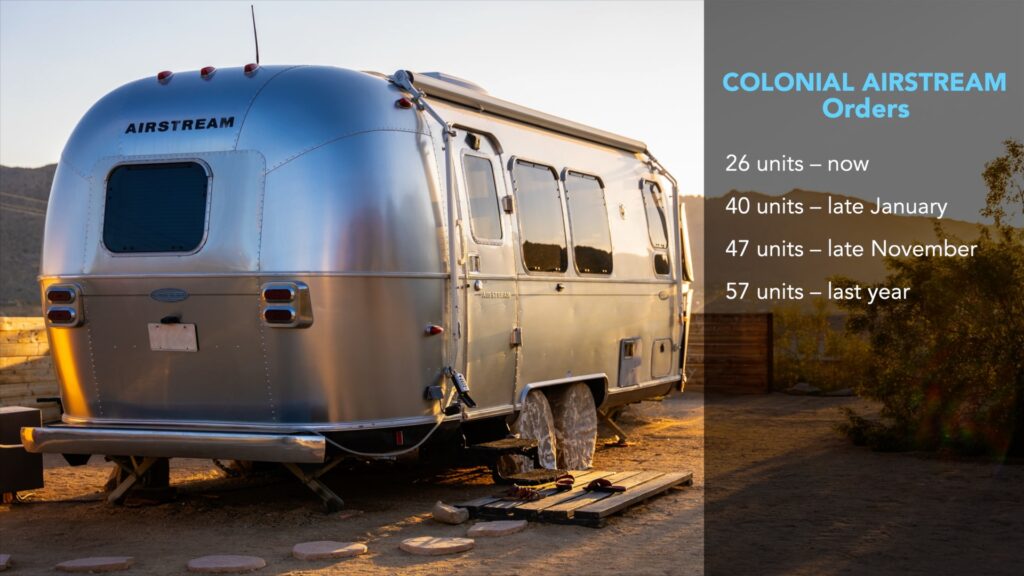
For the high-end market, inventory levels for Colonial Airstream in Millstone Township, New Jersey, the nation’s 2nd largest Airstream dealer, still show a glut of in-stock units.
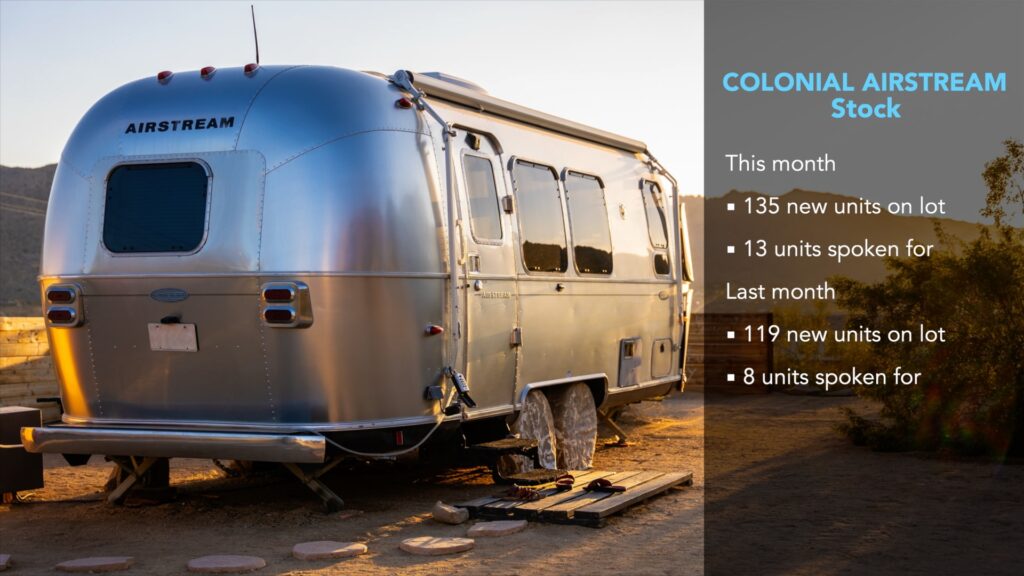
As of March 3rd, Colonial had 135 new units on the lot for sale, with 13 spoken for. This is up from 119 and 8 spoken for about a month ago. Interestingly, Colonial has decreased its order book in the past few weeks, which now stands at only 26 units (vs. 40 in late January and 47 in late November). This time last year, they had 57 units in their order book (more than double the current level). It appears that Colonial has put the brakes on new orders as their lot is full of 2025 models. 2026 models should be arriving in late Spring, so with over 120 high-end new Airstreams on their lot, they seem to be signaling a slowdown in unloading these existing units.
AAA
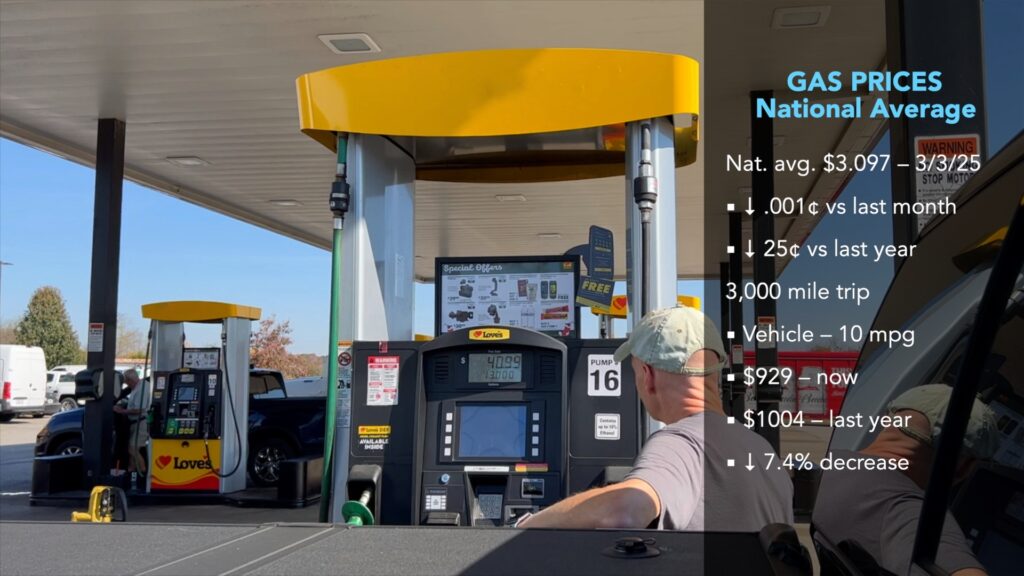
Gas prices have decreased in the past month. According to AAA, the current average nationwide price as of March 3rd was $3.097 per gallon for regular unleaded, down a fraction of a penny from a month ago and down about 25 cents from a year ago. An RV trip of 3,000 miles at 10 mpg would cost $929 now vs. $1004 a year ago, a 7.4% decrease. Diesel prices have also decreased in the past month and currently sit at $3.652 per gallon, down a fraction of a penny from a month ago and down about 41 cents from a year ago. A similar 3,000-mile trip getting 12 mpg would cost $913 now vs. $1,015 a year ago, a 10% decrease.

National Park Budget Woes
There has been a lot of commentary lately about cuts to the budget and resources from U.S. National Park Service. As many of you know, I have a data and financial analytics background, so I tend to look at things based on data. In the next few minutes, I want to shed some light on what’s happening regarding the data for National Parks.
For a very long time, our National Park properties, of which there are about 400 that the National Park Service manages, are heavily subsidized by US taxpayers. When most of us think of National Parks, we picture Yosemite, Glacier, or the Grand Canyon. However, most National Park properties are lesser-known parks, monuments, and battlefields, many of which have no entry fees. About 300 of the 400+ NPS properties do not collect fees for use.
Here is a glance into the budget of the National Park Service for fiscal year 2024, which ran from October 2023 through September 2024. Let’s look at operational expenses first (this includes what is needed to keep things running. Almost all the data is gathered via AI, summarizing many NPS and government data sources.
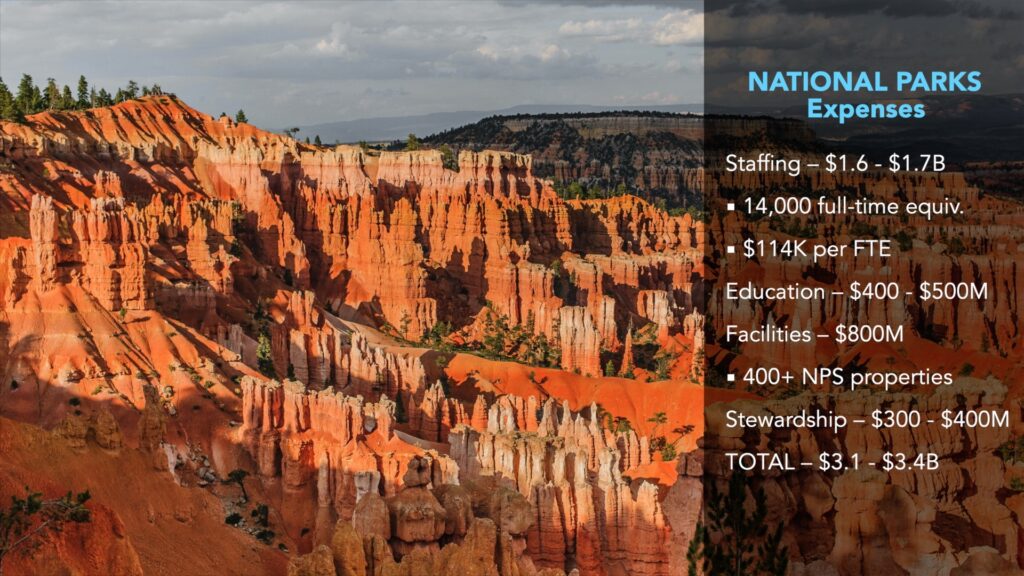
Operation Expenses:
Staffing – The NPS spends between $1.6B and 1.7B on staffing expenses, paying for approximately 14,000 full-time equivalent staff. This averages to about $114k per year per FTE.
Education Programs – Ranger, safety, and other educational programs equal about $400 to $500M annually.
Facility Operation and Maintenance – This amount is $800M and would include operating and maintaining the 400+ current NPS properties. This does not include building or remodeling property or long-term infrastructure projects.
Resource Stewardship – This is $300 to $400M and deals with programs to preserve wildlife & cultural items. I admit that the cultural aspect of this expense item is a bit cloudy to me.
So, the total operational expenses are between a low of $3.1B to a high of $3.4B.
Let’s now turn to operation revenues, which do not include Government appropriations given to cover the shortfall of revenue to expenses:
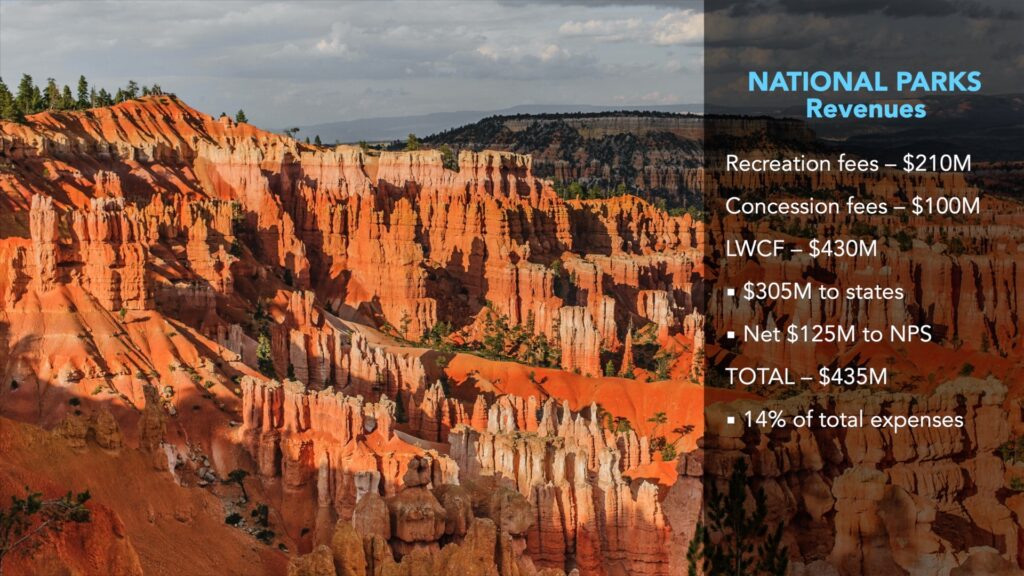
Recreation Fees – These are generally entrance and usage fees, of which 80% of the fees stay at the locations that originate them. The remaining 20% is sent to properties that do not generate any usage fees. This amount is only about $210M for the 2024 fiscal year. We will get into why this is so low in a moment.
Concession Fees – This equaled about $100M for 2024 and contains any concessionary revenue the park generates. Think sales of items and third-party tours made available within the parks.
Land and Water Conservation Fund (LWCF) – The NPS takes in about $430M from this fund based on a fixed revenue tied to offshore energy receipts but passes through about $305M to states. So, the net inflow from this fund is about $125M to the NPS.
Operational revenues are about $435M, or about 14% of expenses. Other grants and donations are minimal to the overall budget, but to be clear, usage and concession fees cover only about 14% of total expenses, which underscores the reliance on general budget appropriations.
One caveat is the potential economic impact of visitors to local businesses and communities. Recent reports estimate visitors spend $55 to $60B in communities and businesses near these park properties. I always take these estimates lightly because if they are accurate, they would only be at risk if one removed the park properties or significantly curtailed visitor numbers. My point is that local communities and businesses would still benefit unless people were prohibited from visiting.
Analysis
NPS properties bring in only about $310M annually in entry and concession fees, or just about $1 per visitor based on the estimated 325-330M total visitors. The NPS spends about $5.10 per visitor on staffing, about $1.25 per visitor on educational ranger programs, and about $2.50 per visitor on facility maintenance.
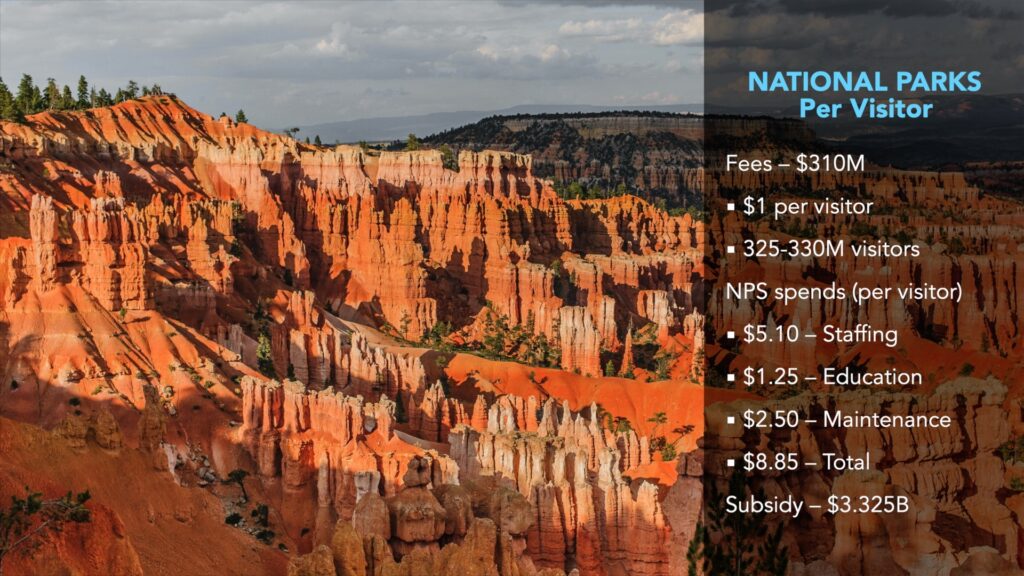
The government subsidized the Park Service to the tune of about $3.325B, which comes from tax revenues of people who do and many who don’t use the Park system. Many argue that the parks are not a business and shouldn’t be run like a business. I think this makes sense to a point. Yet, in the current environment, with a focus on overall expense and debt reduction and a move away from a philosophy of the many subsidizing the few, I think the reality is that the NPS will have to adapt.
One option is to cut costs by lowering services and staffing, which will likely mean the parks suffer shortages and people who visit will have less than best experiences.
To be clear, I think expenses are not all that high at the parks, although one could argue that the $1.6B in staffing for 14,000 FTE (about $114k per FTE) is on the high side. The apparent revenue shortfall is the lack of entrance and concession fees, and there is a good reason for it. If the parks received only $20 per visitor on average at all locations, it would equal $6.2B in revenue. It would be enough never to need government funding and allow for plenty of staffing, maintenance, and programming. It would also free the NPS from regularly going before Congress for renewed appropriations.
So why not just increase visitor fees to increase revenue? This is where the battle starts. For example, a US citizen 62 or older can purchase an annual pass to NPS properties for only $20. A lifetime pass for the same person cost only $80. Think about that for a moment. Anyone 62 or older should take advantage of this great deal; however, it exemplifies the revenue problem. The lack of revenue from such a generous subsidy means taxpayers who don’t use the parks will have to make up the difference in the revenue shortfall.
The fact is that national park properties are heavily subsidized by the tax dollars of non-park users so that senior park users can get very inexpensive entrance fees.
So why not change the revenue structure to fund the parks fully from entrance and concessions fees? Here is an AI synopsis of how the price-setting process works:
“The NPS sets fee policies at a national level, but individual park superintendents have some flexibility to propose specific entrance fees based on their park’s needs, size, and visitation patterns. These proposals must align with a standardized fee structure outlined by the NPS, which groups parks into categories for consistency. Before fees can be implemented or changed, parks are required to engage in public outreach—think comment periods or local meetings—to get input from visitors and stakeholders. Final approval for significant fee changes often comes from NPS leadership or, in some cases, the Department of the Interior, depending on the scale of the adjustment.” Grok AI Summary
Should people who never use the national parks subsidize the national parks (through taxes) to keep entrance fees to a minimum for the minority of those who use the parks? Should people 62 and over be able to get a lifetime pass for only $80? What else should be done?
That should do it. All the best in your camping adventures!
As always, thanks to our fans who support our efforts by starting their shopping from our Amazon Storefront and their generous financial support by using the THANKS feature located under each YouTube video ($ within the Heart icon). Your support is greatly appreciated!
Endnote References Used by AI :
https://www.nps.gov/orgs/1207/budgetproposalfy24.htm
https://www.nps.gov/orgs/1207/2023-budget.htm
https://www.nsf.gov/about/budget/fy2024/appropriations
https://www.nps.gov/aboutus/budget.htm
https://edit.doi.gov/budget/appropriations/2024
https://www.nps.gov/aboutus/visitation-numbers.htm
https://www.nps.gov/subjects/socialscience/visitor-use-statistics.htm
https://www.doi.gov/pressreleases/national-park-visitation-sets-new-record-economic-engines
https://www.usatoday.com/story/graphics/2024/04/20/national-parks-by-visitors/73349324007